TorontoRealtyBlog
I think the very first thing to address in today's blog is recap from Monday's blog post.
We looked at nine downtown neighbourhoods and examined the turnover rate in each building, to come up with an area average.
This is obviously an inexact science, as I didn't take all the buildings in that given area, but rather a generous sample – around 20 buildings in each area, where the area provided.
There's also potential debate about geography, but I'm labelling the areas as I see them through my Realtor-lens.
Here's how the nine areas stacked up against each other:
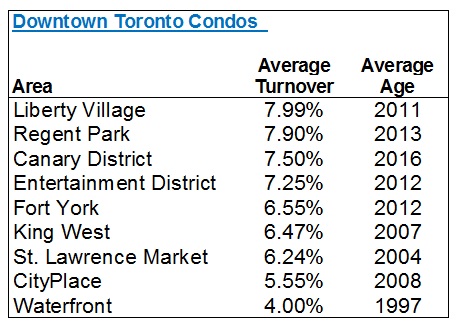
From high to low, we have almost precisely double the rate of turnover.
That's a generous spread, no?
Average out those nine areas, and you'll conclude that the average rate of turnover is 6.61%.
However, I took looked at the total sales from the 133 buildings I examined (exactly 2,800), and all the units, (44,071), and found a more true average of 6.35%.
So that's it, folks.
Your answer is 6.35%.
That is, in my opinion, based on my examination of these nine areas and 133 buildings, the "average rate of turnover in the downtown Toronto condo market."
Coming into this, I think most people would have provided a wild guess of between 5-10%. And in the end, I think 6.35% is marginally lower than what I would have predicted, which would have been about 7.5%.
But let's look at the numbers again, and try to identify other patterns.
First and foremost, how does the age of building affect the rate of turnover?
We already have a guess, based on the "Waterfront" district showing only a 4.00% rate of turnover, with an average building age of 1997, when the next-lowest average is 2007!
Dividing a line at the year 2000, here's how the average turnover looks:
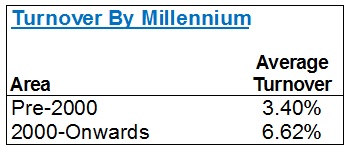
That's a massive swing!
Nearly double the rate of turnover once again.
And from this, you might generalize, or conclude, that the waterfront is home to older condos, and many older people, who stay for a longer period of time. I think that's fair. And I also think it's fair to suggest that the "condo boom" of the last 10-15 years has been driven by a younger generation who buy condos downtown because it's closer to work, and thus they're far more likely to sell before a retiree. The condo boom has also been driven by investors, who often sell units that they purchased in pre-construction, as soon as the buildings are registered.
Now if that year-2000 dividing line isn't exact enough for you, then let's look at by decade:
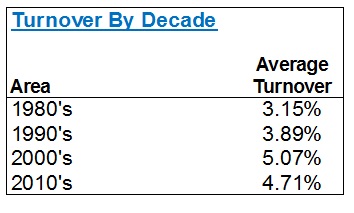
Once again, we see the 80's and 90's provide for turnover at sub-4% rates, and the newer construction is higher.
For those of you who live and breathe stats, you might wonder how the first graphic shows such a huge swing for Pre/Post-2000 condos, and by decade, the data looks a bit skewed. This is because the sample size for Pre-2000 was much, much smaller.
The second way I wanted to look at the data was by building size, and here's where I'm a bit more surprised.
I fully expected there to be far less turnover in smaller buildings, but in the end, the data suggests otherwise.
Let's start with 200-units as our dividing line:
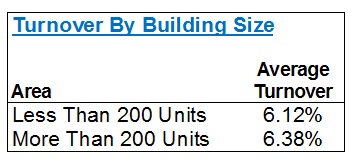
There's almost no difference. 6.12% vs. 6.38% is essentially a rounding error.
So what if we flush this out a little more? Perhaps look at 0-200, 200-400, and 400+?
We're basically looking at the same thing:
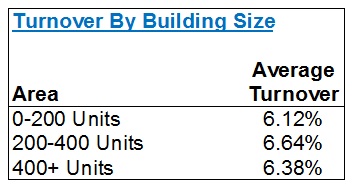
And in case you're wondering, the rate of turnover for units of 0-100 units is 5.31%.
That's the only place where I see any difference.
Considering the average in the downtown core is 6.35%, as established above, the fact that we see these 6.12%, 6.38%, 6.64%, and 6.38% figures tells me there's almost zero impact on the average rate of turnover, by the size of the building.
It's worth noting that a few of the 133 "buildings" I looked at were composed of two towers (ie. you could have two 170-unit buildings together, as "one" building of 340 units), but I don't believe that has any impact on this data.
So let me show you one last chart, and for this, I want to go back to age once again.
With the average rate of turnover at 6.35%, and the average rate, post-2000, of 6.62%, are there any real differences if we segment those post-millennium years even further?
Yes. Yes there is.
And it's exactly what you would expect:
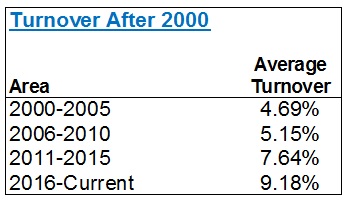
That data set reads perfectly!
From the "newer" buildings, post-2000, we still see the ageist trend.
2016 and 2017 condos (recall I didn't use 2018 as I wanted a full year of data) are turning over at a 9.18% rate. And I would assume that an annualized rate for any condos registering in 2018 would likely show a 10-12% turnover rate, based on this trend.
As you go back in time, the turnover rate cools.
I was having a conversation today with a client about the lack of detached homes, in his neighbourhood, and the reason for that low inventory. I explained that his house is a 15-20 year house for a buyer who has the desire, and wherewithal, to stay there. This is the $2,000,000 market, FYI. I further explained that in areas where you can still find a two or three bedroom semi-detached for $800,000 – $1.1M, many buyers consider those to be 6-8 year houses. For some, that's 3-5 years.
So when we look at condominium turnover, we have to consider the location, the age of the building, and thus the demographic that is attracted. We also have to consider the price point, and market trends.
I don't have statistics on the length of ownership of condos versus houses, but I would make a very educated guess that there is less turnover in the housing market than the condo market. Would you not agree?
In the condo market, we have more first-time-buyers than in the housing market. We also have a lower average cost, and thus we're looking at a much younger buyer, for the most part.
In fact, the only place this trend skews off point is with respect to downsizers who sell in the housing market, and buy in the condo market. Their time horizon is much longer, and I believe, as noted above, this explains the 4.00% turnover rate in the Waterfront area, which is home to a lot of older condos.
On the flip side, your typical 25-year-old condo buyer does not expect to live there forever, and grow old(er).
That buyer is more likely to find a partner, get married, start a family, and move to a house, a larger condo, our out of the core (another growing trend).
And the last part of the turnover-explanation is something I have alluded to several times now, and that's the investment-buyer factor. Some investors will purchase in pre-construction, keep the unit through occupancy and into registration, and hold it long term. But many, and I'd say more, look to sell upon registration. This explains why the newer buildings have higher turnover – a horse I believe we've successfully beat by this point.
All told, I think a prospective condo buyer who is tartetting any building in the downtown core would be wise to consider this data.
I can't tell you how often a buyer tells me, "I want to live at the such-and-such lofts," without having any idea of the extremely low-percentage chance that he or she has of actually finding a unit up for sale, and having that unit be the right size, style, and price.
Happy hunting!
The post A Further Look At Condo Turnover In The Downtown Core appeared first on Toronto Realty Blog.
Originated from https://ift.tt/2TuewAZ
No comments:
Post a Comment